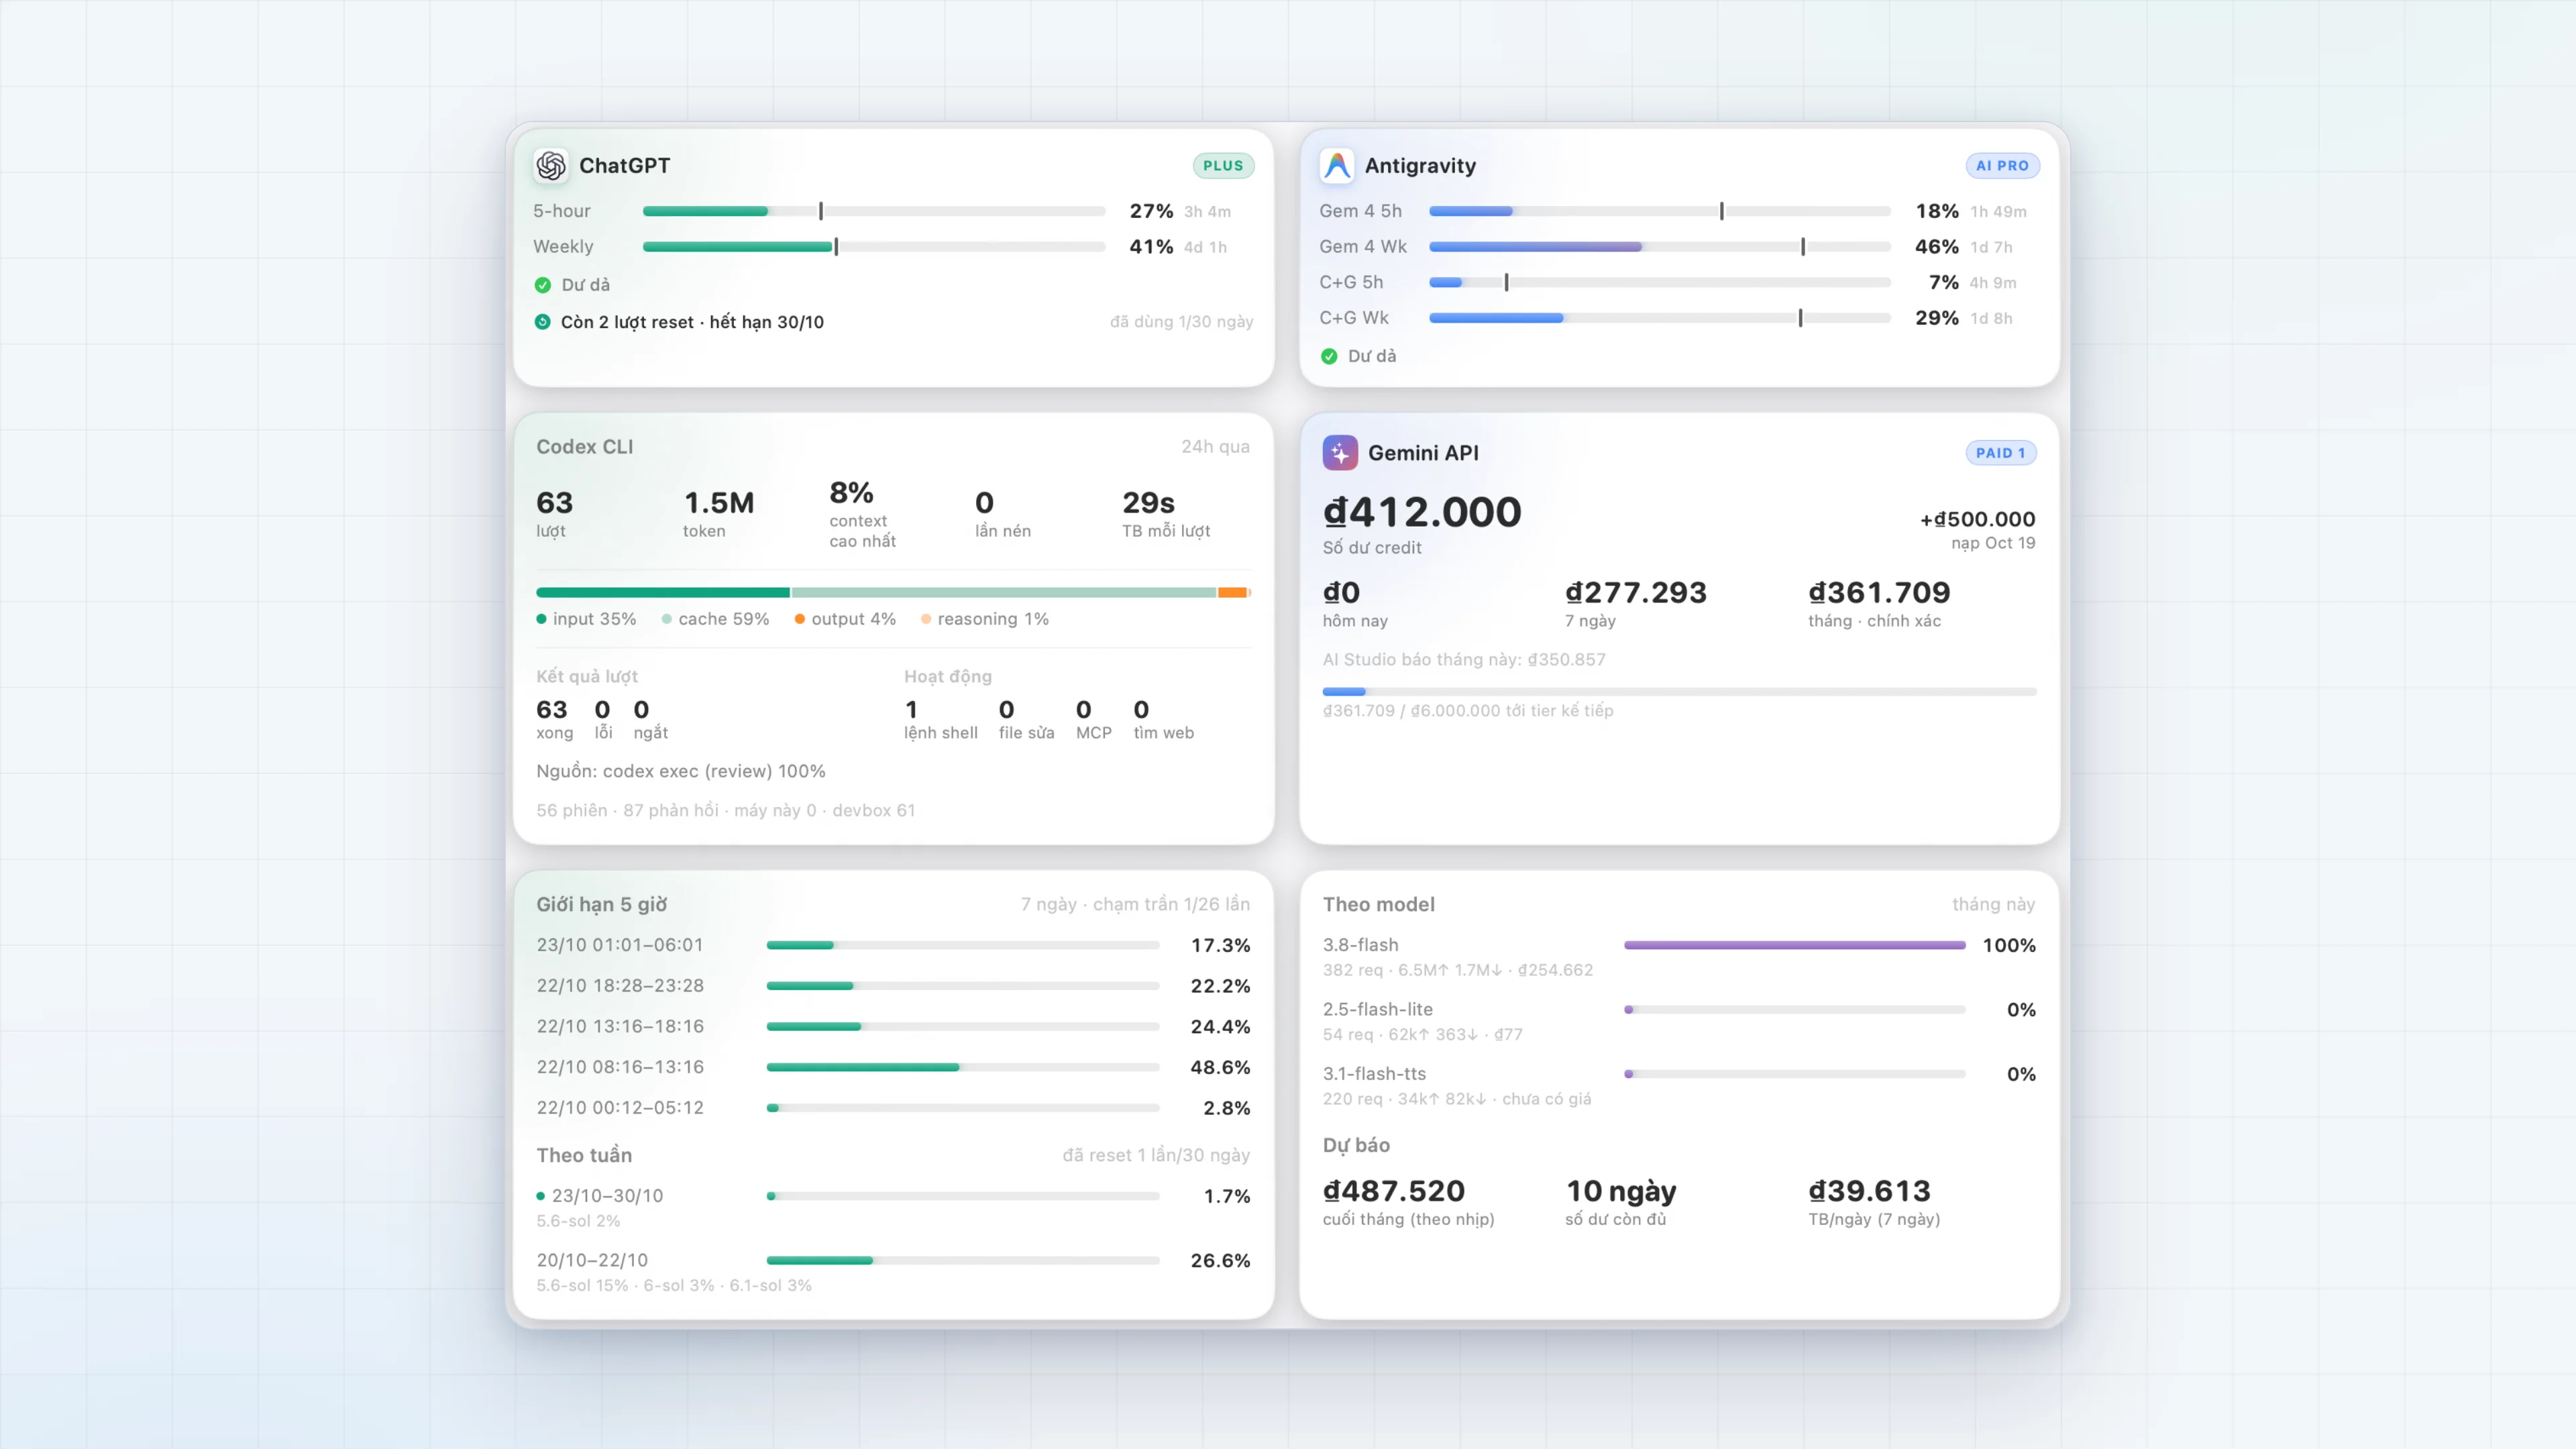
The Gemini API is the only source measured in money rather than quota percent. This card shows the credit balance, cost by day and by model, and how many days the balance will last.
Cost comes from four layers of data
AIUsage combines several sources to give the best figure at any moment:
- Cloud Monitoring: token and request counts per model per day. Cost is estimated as tokens times Google's price list.
- A local price table: per-model prices stored locally. A model with no price shows "no price yet" instead of being counted as zero.
- BigQuery billing export: exact daily cost, cache discounts included, once Google has created the export table. Queried at most every 6 hours.
- The AI Studio Billing page: credit balance, latest top-up, tier cap and Google's own month-to-date total, read through the helper.
BigQuery can lag by several days. Until it catches up, "today" and "7 days" use the estimate and the label reads "exact up to ...". Top-up invoices, which belong to no project, are not added to monthly spend.
What the card shows
| Item | Meaning |
|---|---|
| Credit balance | The current balance and the latest top-up |
| Today, 7 days, month | Cost for each period; the monthly figure says "exact" when it comes from BigQuery |
| AI Studio reports this month | Google's own figure for comparison; a token-based estimate typically runs about 10% high because it ignores cache discounts |
| Progress to the next tier | Cumulative spend against the threshold for the next tier |
| By model | Share of spend, request count and tokens in and out for each model |
| Forecast | End-of-month spend at the current pace, days the balance will last, average daily spend |
30-day spend calendar
A weekly grid of cells: each cell is a day, darker for higher spend, and the outlined cell is today. See Widget and dashboard window.