Context
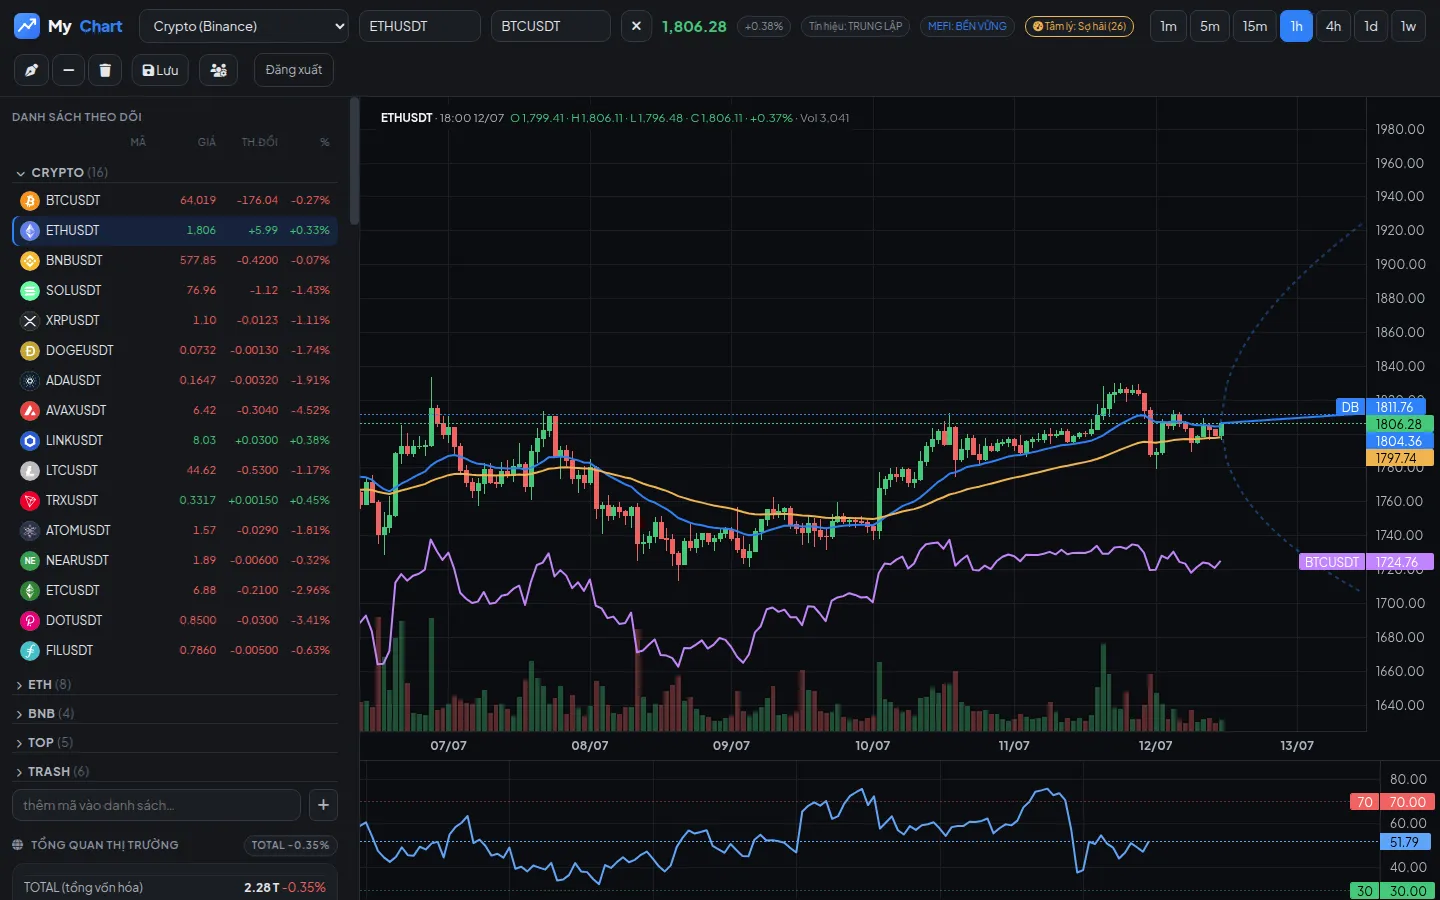
Analysis tools are usually paid and closed. MyChart is self-built, runs free real data, and merges technicals + money flow + forecasting + AI on one screen.
Breakdown
Multi-market data
Crypto (Binance), VN stocks (VNDirect), US stocks / gold / forex (Yahoo), refreshing every 30s.
Charts & indicators
Real-time candles, 15+ indicators (RSI, MACD, MFI, CMF, OBV, ATR, ADX, Stochastic, EMA, Bollinger, VWAP, Volume Profile).
MEFI money-flow score
Proprietary cycle scoring (accumulation / sustainable / overheated / risk) from a blend of indicators.
Forecasting & backtest
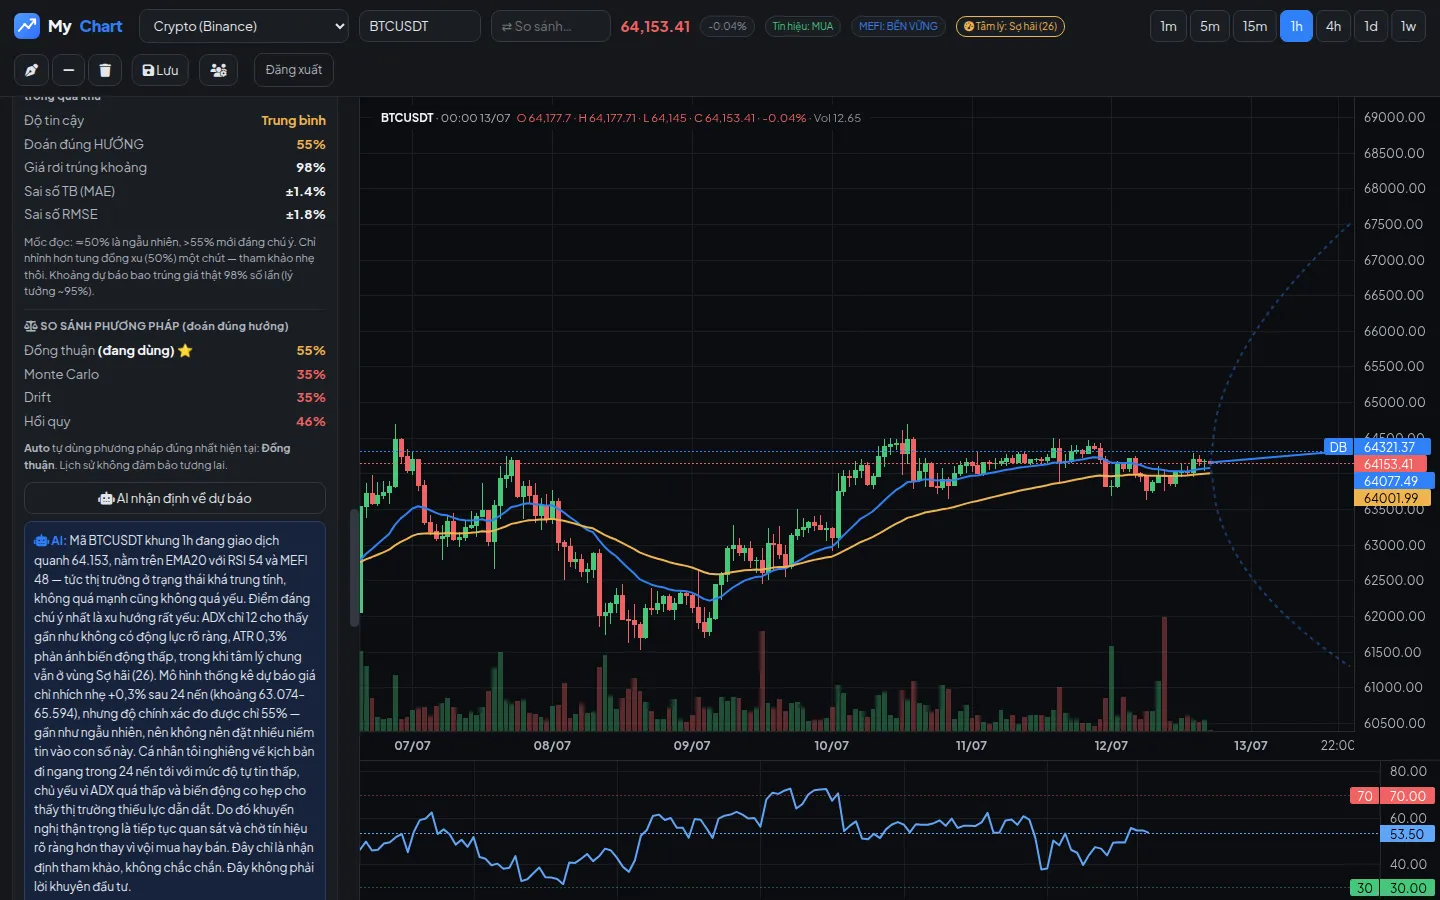
Monte Carlo, regression, drift+volatility, consensus, each backtested for accuracy (direction hit-rate, MAE, RMSE).
AI
A Claude call reads all the numbers and gives a plain-language read.
Highlights
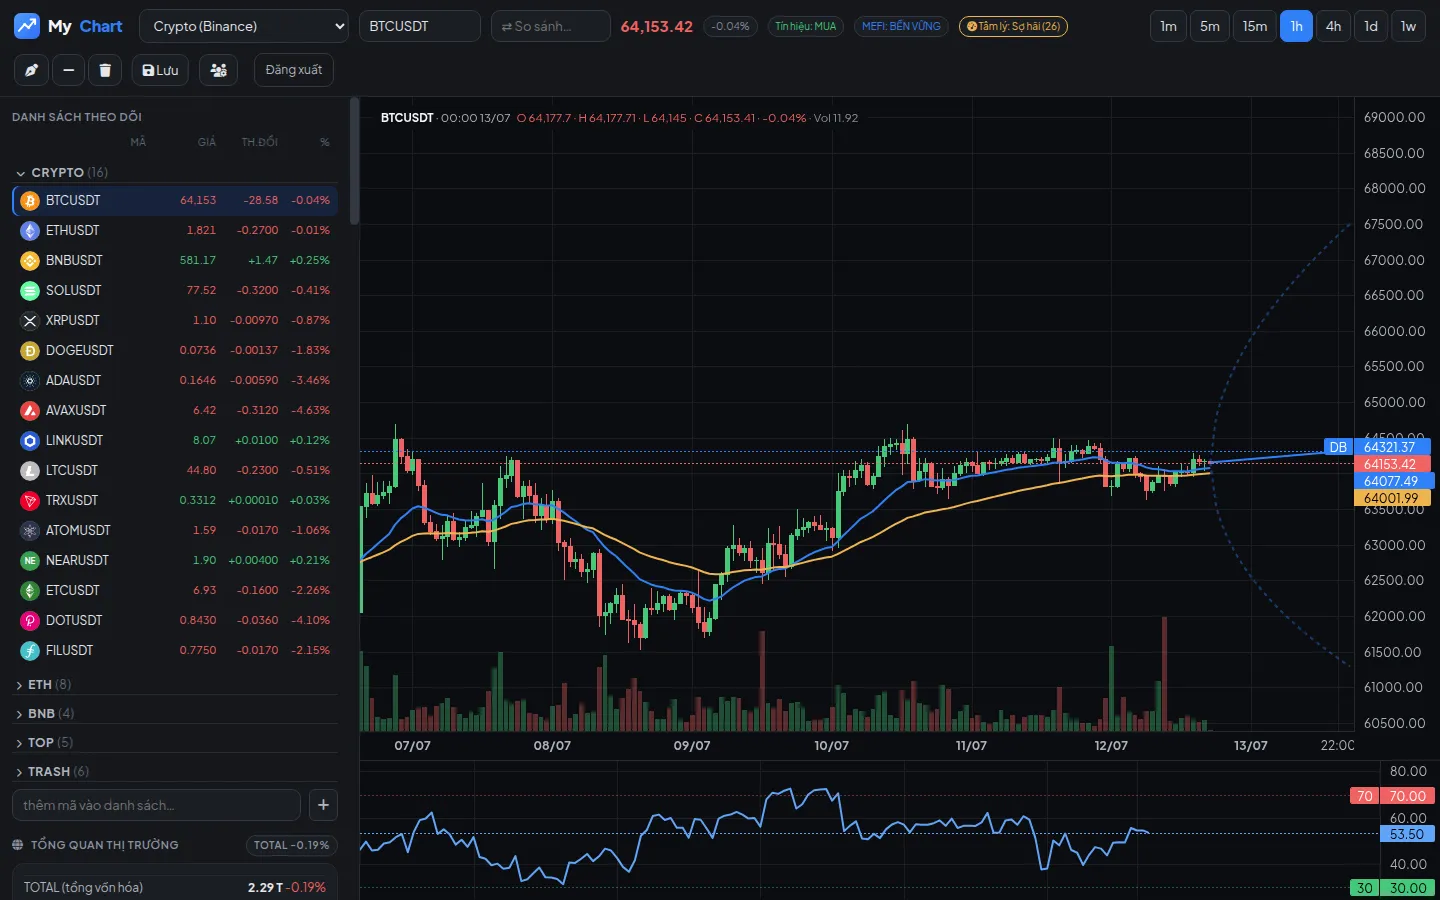
- Real-time multi-market charts (crypto, VN/US stocks, gold, forex) over WebSocket.
- 15+ technical indicators, grouped watchlists, multi-timeframe.
- Proprietary MEFI money-flow score + market sentiment.
- Backtested price forecast comparing 4 methods (Consensus / Monte Carlo / Drift / Regression) with MAE/RMSE error.
- Claude-powered analysis, always with risk warnings (no buy/sell hype).
Compared to popular platforms
| Feature | MyChart | TradingView | Investing.com |
|---|---|---|---|
| Real-time multi-market charts | ✓ | ✓ | ✓ |
| Technical indicators | 15+ | 100+ | ~20 |
| Proprietary money-flow score (MEFI) | ✓ | ✗ | ✗ |
| Price forecast + error metrics (MAE/RMSE) | ✓ | ✗ | ✗ |
| Compares multiple forecast models | ✓ (4) | ✗ | ✗ |
| AI-powered analysis (Claude) | ✓ | ~ (paid) | ✗ |
| Positioning | Personal analysis tool | Pro charting platform | News + data |
TradingView has far more indicators; MyChart's edge is MEFI money-flow, forecast error metrics and honest AI analysis.